How to Debug
In the Detox world, you can debug either Detox itself (i.e. run it step by step), and the tested app. This guide covers both options.
Running Detox Tests Step-by-Step
Detox tests can be run step-by-step either using an IDE or by using Chrome debugger.
Detox now supports an interactive REPL (Read-Eval-Print Loop) mode for debugging. You can explore app state, issue commands, or pause test execution — all in real time.
Enable it via --repl CLI argument and add await detox.REPL() in test code.
Start by running Detox using the Detox CLI alongside the inspection argument (--inspect-brk) and the file in which the test resides. For example:
detox test --inspect-brk -c android.emu.debug e2e/starter.test.js
You will see Detox starts and these logs:
Debugger listening on ws://127.0.0.1:9229/3dedd03b-8896-4ab8-a0a8-1b647abb9c98
For help, see: https://nodejs.org/en/docs/inspector
Now you can attach to Detox and tap-in into its execution process.
To learn more about debugging with --inspect-brk, refer to Debugging — Getting Started on the official Node.js website.
- Webstorm
- vs-code
- Chrome
Open your app project (where there tests are, among other things) on Webstorm.
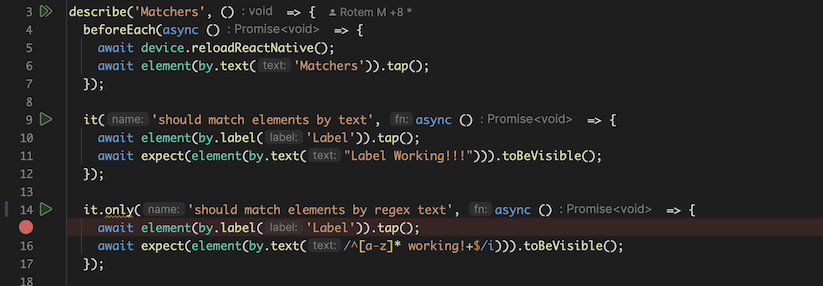
Set up a breakpoint
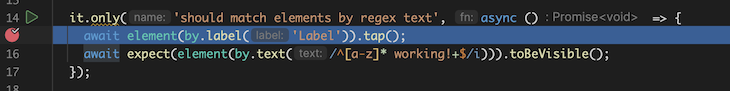
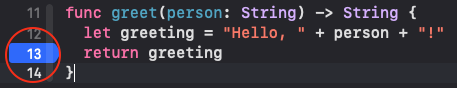
Open the file where the test you wish to run is. Mark it as it.only, and set up a breakpoint in a line that suites your needs (note: This can actually be inside a helper function or a test-driver's function):
Create & Run a debug configuration
Go to Webstorm's Edit Configurations.
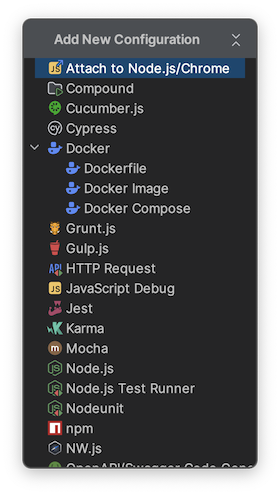
Tap the + button and select the Node.js option:
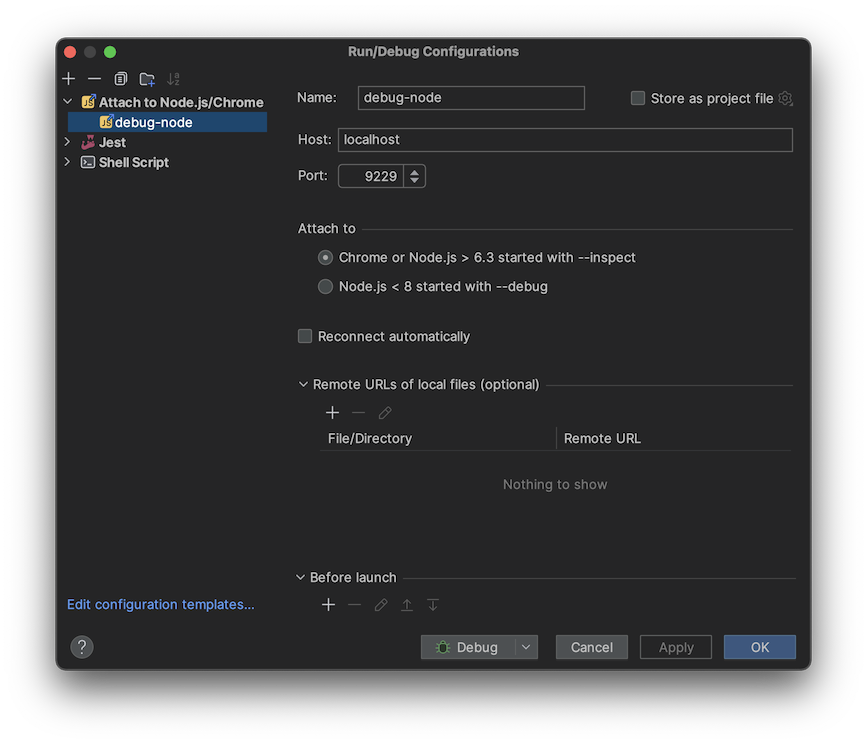
Create a new debugging configuration using the default arguments (port 9229, etc.):
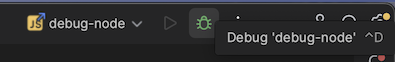
Attach to Detox by "debugging" the new configuration (start it using the beetle button).
Let Detox run until stopped at the break-point:
Run step-by-step using Webstorm's debugging actions (step-over, step-into, etc.)
Happy debugging!
Coming soon!
Edit your test file. Mark the test you wish to debug as it.only, and then add a debugger statement
inside your test to mark a starting point, e.g.:
 describe('Example', () => {
   beforeAll(async () => {
     await device.launchApp();
   });

-   it('should debug nicely :-)', async () => {
+   it.only('should debug nicely :-)', async () => {
     await element(by.text('Filter')).tap();
+     debugger;

   });
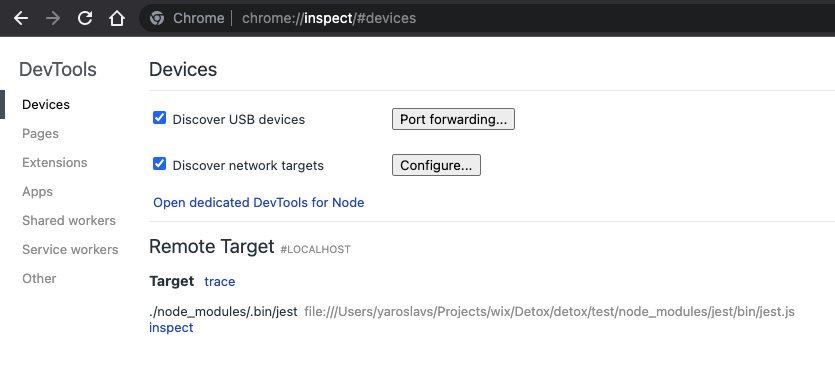
Open Google Chrome and go to chrome://inspect tab, where you'll see ./node_modules/.bin/jest as a remote
target waiting until you click inspect to attach to it.
Happy debugging!
Debugging JavaScript application code
Use debug configurations of your app that rely on React Native Packager running on port 8081 (or another):
ios.sim.debugandroid.emu.debug
For the rest of details, please refer to React Native – Debugging.
Debugging Native application code
Setting Detox up as a compiling dependency
This step is optional. It is intended for investigating weird crashes or when contributing to Detox itself.
- iOS
- Android
Go to
node_modules/detoxand extractDetox-ios-src.tbz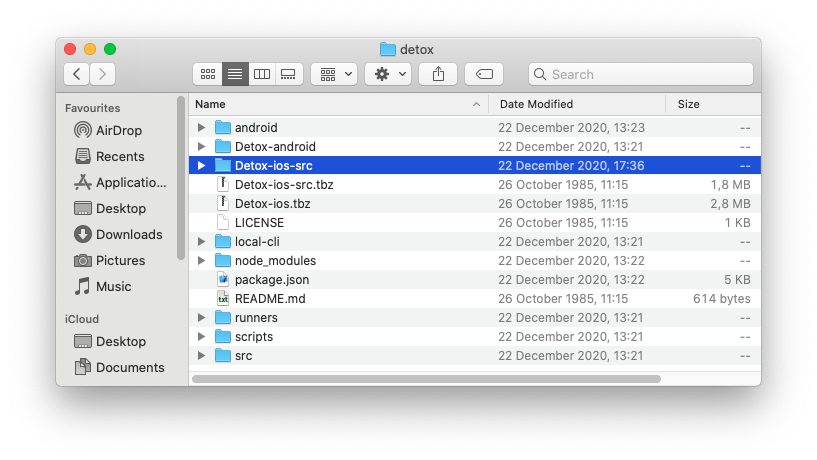
Drag
Detox-ios-src/Detox.xcodeprojinto your Xcode project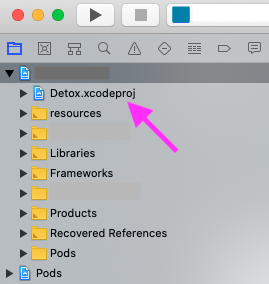
Go to your project settings → General and add Detox.framework to Frameworks, Libraries, and Embedded Content (make sure Embed & Sign is selected under Embed)
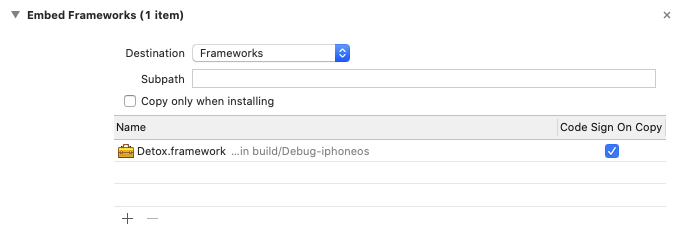
Apps should not be submitted to the App Store with the Detox framework linked. Follow this guide only to debug Detox issues in your project. Once finished, make sure to remove Detox.framework from your project.
Add in your Android project settings:
android/settings.gradle+include ':detox'
+project(':detox').projectDir = new File(rootProject.projectDir, '../node_modules/detox/android/detox')In your root build script register
google()as a repository lookup point in all projects:android/build.gradleallprojects {
repositories {
// ...
+ google()
}
}If
allprojectssection doesn't exist, then add it.In your app’s build script, add to
dependenciessection:android/app/build.gradledependencies {
// ...
- androidTestImplementation('com.wix:detox:+')
+ androidTestImplementation(project(path: ":detox"))
}Stay in that file, just scroll down and add to the
defaultConfigsubsection:android/app/build.gradleandroid {
// ...
defaultConfig {
// ...
+ testBuildType System.getProperty('testBuildType', 'debug') // This will later be used to control the test apk build type
+ testInstrumentationRunner 'androidx.test.runner.AndroidJUnitRunner'
+ missingDimensionStrategy 'detox', 'full'
}
}
Add a "manual" configuration to your Detox config
- iOS
- Android
{
  "devices": {
    "simulator": {
      "type": "ios.simulator",
      "device": {
        "type": "<e.g., iPhone 12 Pro>"
      }
    }
  },
  "apps": {
    "ios.debug": {
      "type": "ios.app",
      "binaryPath": "<path to your app binary built before>"
    }
  },
  "configurations": {
    "ios.manual": {
      "device": "simulator",
      "app": "ios.debug",
      "behavior": {
        "launchApp": "manual"
      }
    }
  }
}
{
  "devices": {
    "emulator": {
      "type": "android.emulator",
      "device": {
        "avdName": "<e.g., Pixel_API_28>"
      }
    }
  },
  "apps": {
    "android.debug": {
      "type": "android.apk",
      "binaryPath": "<path to your app binary built before>"
    }
  },
  "configurations": {
    "android.manual": {
      "device": "emulator",
      "app": "android.debug",
      "behavior": {
        "launchApp": "manual"
      }
    }
  }
}
While the behavior section is a mandatory thing to include, there are a few more optional
parameters to disable various side effects and make life easier when debugging:
 {
   …
   "configurations": {
     "<your configuration>": {
       …
       "behavior": {
         "launchApp": "manual"
       },
+      "session": {
+        "autoStart": true,
+        "debugSynchronization": 0,
+        "server": "ws://localhost:8099",
+        "sessionId": "test"
+      },
+      "testRunner": {
+        "args": {
+          "testTimeout": 999999
+        }
+      }
+      "artifacts": false
     },
   }
 }
Using a preconfigured
sessionwith an auto-starting server removes the legwork of copying and pasting values to the instrumentation runner launch arguments dialog every time before any launch from the IDE. Otherwise, by default when thesessionobject omitted,serverandsessionIdare randomly generated for every new test session.The
debugSynchronization: 0override matters only if you have a globalsessionconfig withdebugSynchronizationset to a positive integer value. Otherwise, it is not needed. The point is to disable regular app polling requests during debugging, since that only can hinder the debugging.If you are using Jest as a test runner, you might want to prolong the test timeout via forwarding
--testTimeout 999999to it.Setting
artifacts: falseoverride also matters only if you have a globalartifactsconfig. The motivation is to disable irrelevant taxing activities on the device such as capturing logs screenshots, videos and so on. If your investigation addresses a specific artifact plugin glitch on the native side, then just disable all the non-relevant plugins. See Configuration > Artifacts document for the reference.
Run a specific test
Usually, you would want to focus on a specific test suite to save time, e.g.:
- iOS
- Android
detox test -c ios.manual e2e/someSuite.test.js
detox test -c android.manual e2e/someSuite.test.js
Don't use multiple workers, e.g. -w, --maxWorkers for Jest, if you set session.sessionId to a constant value.
Afterwards, you should see your test suite starting as usual until it reaches the app launch, where Detox stops instead and prompts you to launch the app from the IDE:
- iOS
- Android
18:26:07.024 detox[45214] i Waiting for you to manually launch your app in Xcode.
Make sure to pass the launch arguments listed below:
  -detoxServer ws://localhost:8099
  -detoxSessionId com.wix.detox-example

Press any key to continue...
You’ll need to run your app with the said arguments from Xcode:
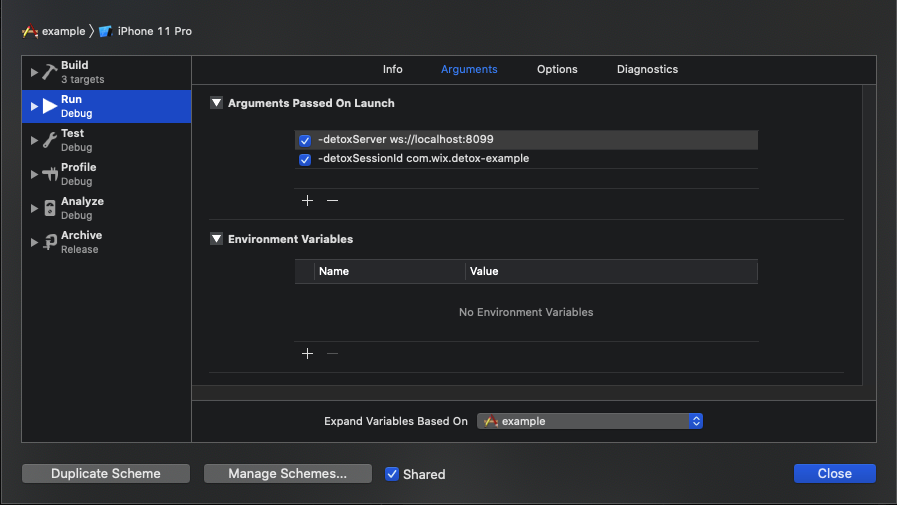
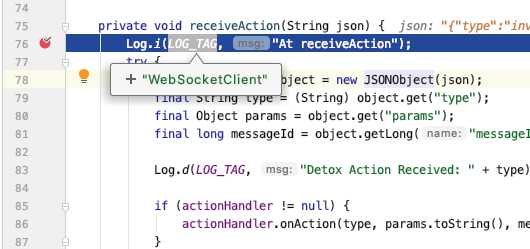
Before you launch the app, make sure to put breakpoints at the points of interest, e.g.:
Launch the app with the debugger attached:
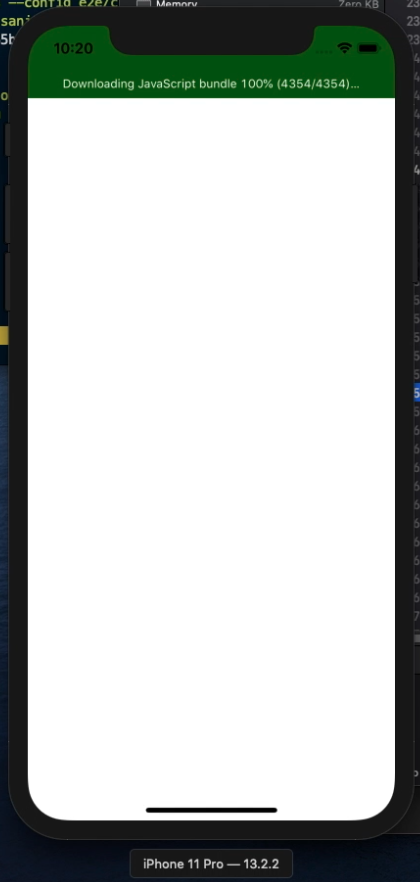
The moment you see the app is idle, go back to the Terminal where Detox is running and press any key. If you wish to terminate the process for some reason, use Ctrl+C. In a couple of seconds you are expected to see a confirmation from Detox, e.g.:
Found the app (com.wix.detox-example) with process ID = 16854. Proceeding...
Now the entire test will run as usual until it sends an action to the app, which gets trapped in your breakpoint.
Happy debugging!
18:26:07.024 detox[45214] i Waiting for you to manually launch your app in Android Studio.

Instrumentation class: com.wix.detox.test.test/com.example.DetoxTestAppJUnitRunner
Instrumentation arguments:
------------------------------------
Key            | Value
------------------------------------
detoxServer    | ws://localhost:8099
detoxSessionId | test
------------------------------------

Press any key to continue...
Now it is time to switch back to Android Studio. You’ll need to run your instrumentation runner with the said arguments,
this is why you should create a debug configuration of Android Instrumented Tests type similar to the one below:
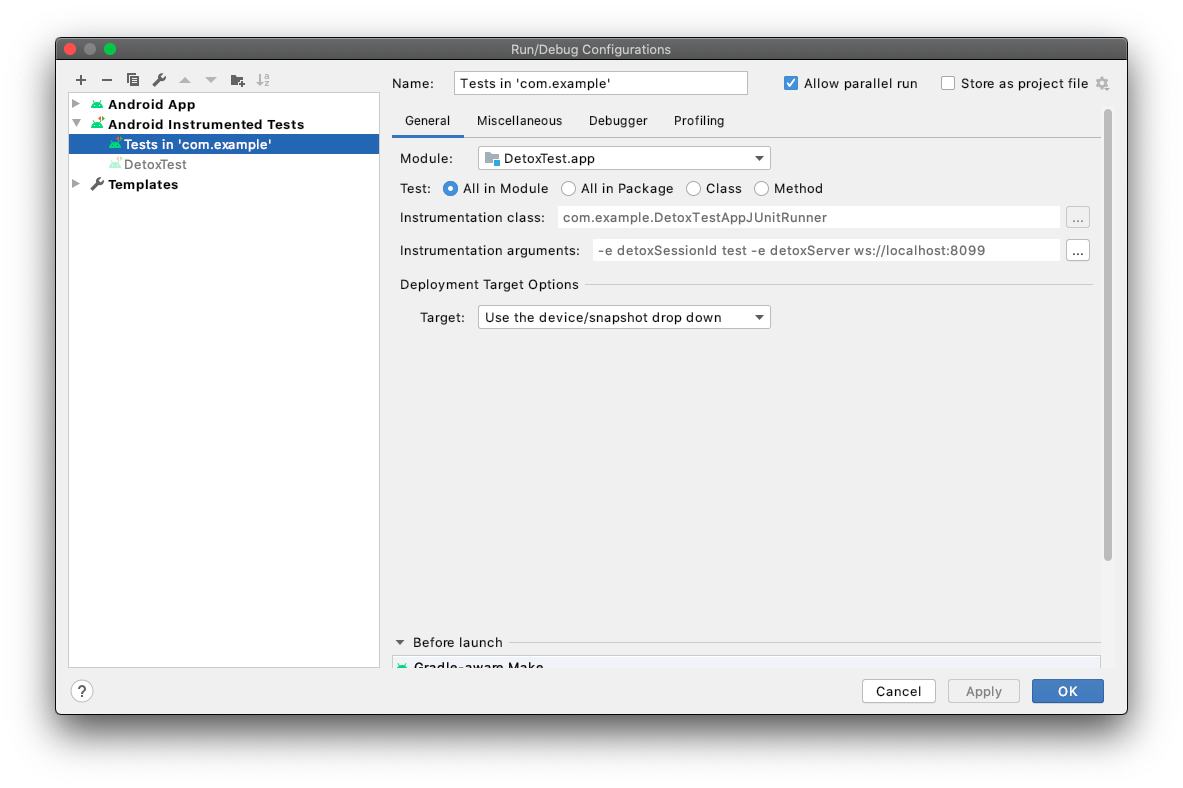
Make sure to put breakpoints at the points of interest before you start the app.
After the app is launched, go back to the Terminal where Detox is running and press any key. As a result, you are expected to see a confirmation from Detox, e.g.:
Found the app (com.wix.detox-example) with process ID = 16854. Proceeding...
Now the entire test will run as usual until it sends an action to the app, which gets trapped in your breakpoint.
Happy debugging!
Troubleshooting
- iOS
- Android
Here are some known issues you can solve on your own:
DetoxWSClient: Retrying... At connectToServer
I/DetoxWSClient: At connectToServer
D/DetoxWSClient: Retrying...
If you see the repeatedly printed messages like above in Android application logs, it's likely that your port is not reversed. Assuming you're following the tutorial and
detoxServeraddress isws://localhost:8099(if not – check what Detox prints you), reverse the port on your device using ADB:adb reverse tcp:8099 tcp:8099Waited for the new RN-context for too long!
Waited for the new RN-context for too long! (60 seconds)
If you think that’s not long enough, consider applying a custom Detox runtime-config in DetoxTest.runTests().
If you see an error like above, you can patch Detox code to disable the timeout here:
detox/android/detox/src/main/java/com/wix/detox/config/DetoxConfig.ktpackage com.wix.detox.config
class DetoxConfig {
@JvmField var idlePolicyConfig: DetoxIdlePolicyConfig = DetoxIdlePolicyConfig()
- @JvmField var rnContextLoadTimeoutSec = 60
+ @JvmField var rnContextLoadTimeoutSec = Int.MAX_VALUE
fun apply() {
idlePolicyConfig.apply()